Lab 1: Query and Analyze Logs
1. Instructions
You're on the DevOps team at Storedog. Your team recently set up Datadog Log Management to ingest, structure, and enrich all logs from the Storedog app.
Customers have reported that the advertisements and discounts aren't appearing in the Storedog app. Your team lead has asked you to use Datadog Log Management to find the source of the errors.
You don't need to fix the errors, but you've been asked to do the following:
Find logs that are related to these errors in the advertisements and discounts services of the app.
Create a Saved View for the error logs that you can share with your team. The saved view should show the count and percentage of logs grouped by service.
Enable the team to search for the file path that the error originates from in the source code.
In this lab activity, you'll do the following to achieve your goals:
Build a search query using relevant facets and search terms
Create a Saved View for log analytics
Add a new facet for the file path attribute
2. Search for the error logs
When your team set up the Storedog app for monitoring with Datadog, they assigned the advertisements service the service:store-ads tag and assigned the discounts service the service:store-discounts tag.
You can use these tags to search for logs that are related to the errors. As you search, you'll use the search field and the facets list to build the search query.
In the time picker, set the time range to
Past 15 minutes.In the facets list, click the
Servicefacet group to expand it and then clickstore-ads. You'll seeservice:store-adsadded to the search field. The Log List only displays logs forservice:store-ads.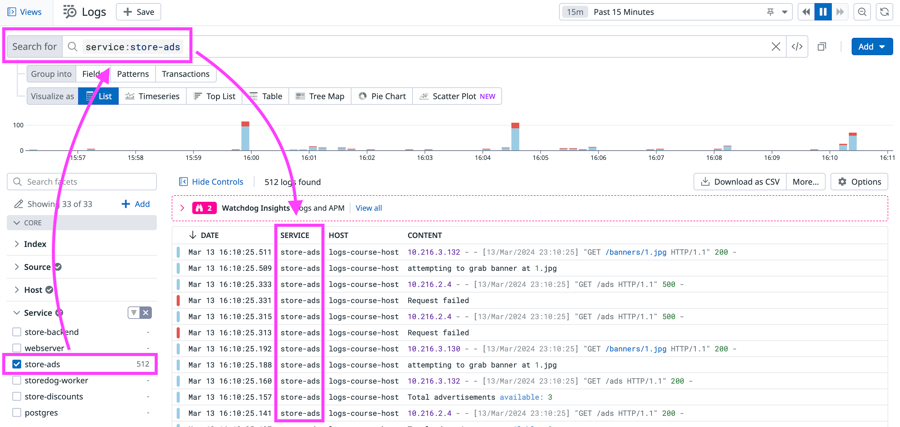
Click one of the logs in the Log List to open the details side panel.
Browse the top of the log details. You'll see the log status, date and time, and a few key tags such as
host,service, andsource. If you click these, you'll see options for querying related logs in Log Explorer and for viewing related dashboards or pages in Datadog.Below the key tags, browse the list of ALL TAGS. Click the +22 button at the end of the list to expand the list of tags. Here, you'll see that
service:store-adsis listed. You can use the search field in the tag list to find theservice:store-adstag.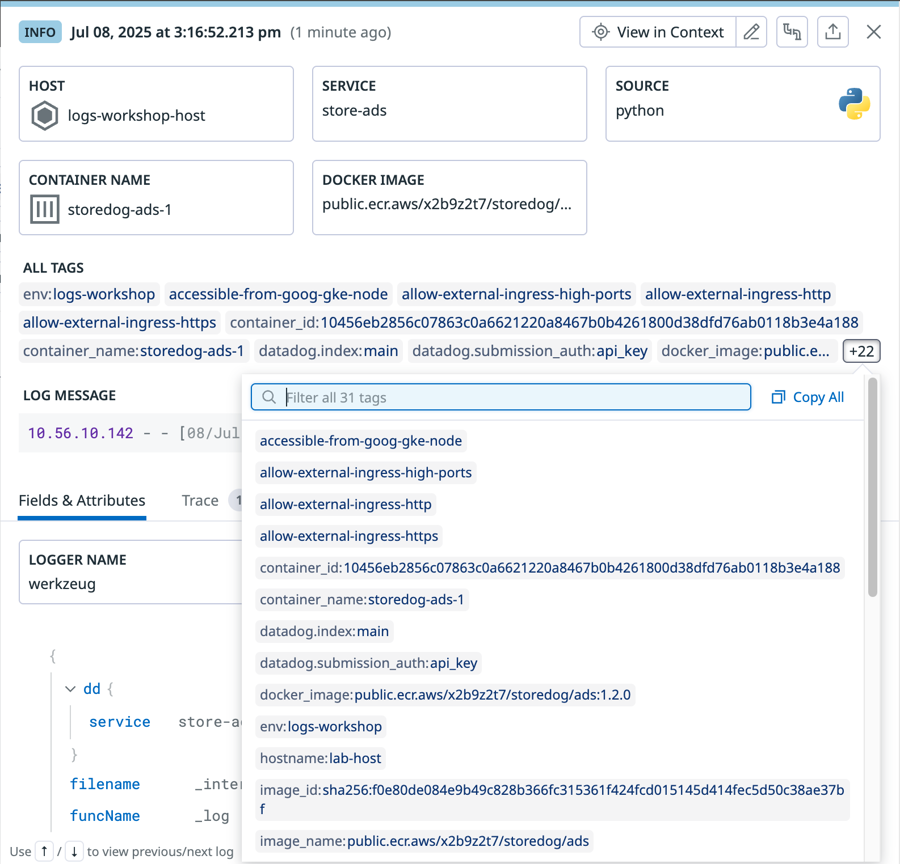
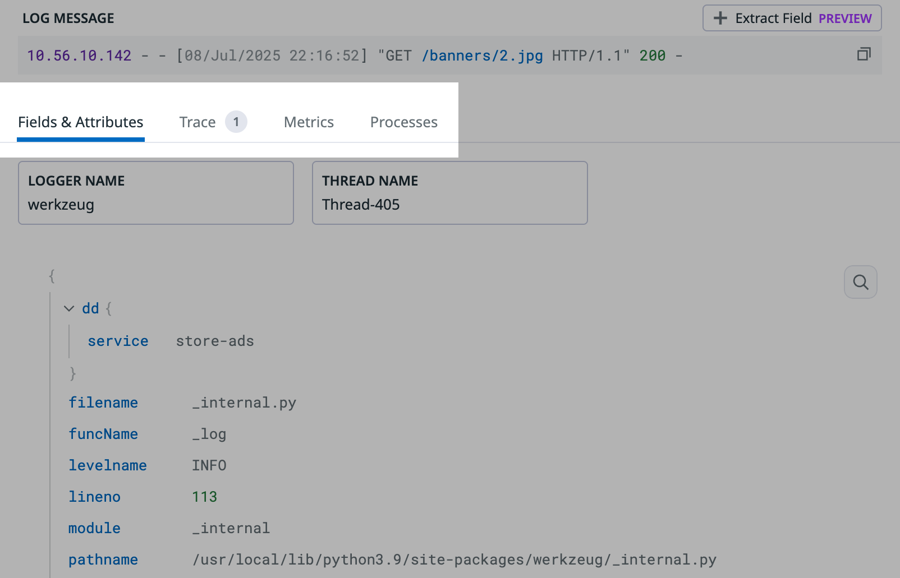
Below ALL TAGS is the official log message of the log. This log message is displayed in the CONTENT column in the Log List. In the search field above the Log List, you can search parts of this message or the whole message as a string so that you can find other logs with similar log messages.
Below the log message, click each tab and browse its contents.
Fields & Attributes lists all attributes from that log that were either in JSON format when the log was ingested, or were parsed from the log during processing after ingestion.
Trace shows the trace associated with the log, if log and trace correlation is configured. From here, you have the option to View Trace in APM.
Metrics displays host and container metrics associated with the logs. If you click any graph, you'll see options to view related data and dashboards in Datadog.
Processes are related processes running on the host and container.
Click the X in the top right corner of the panel to close it.
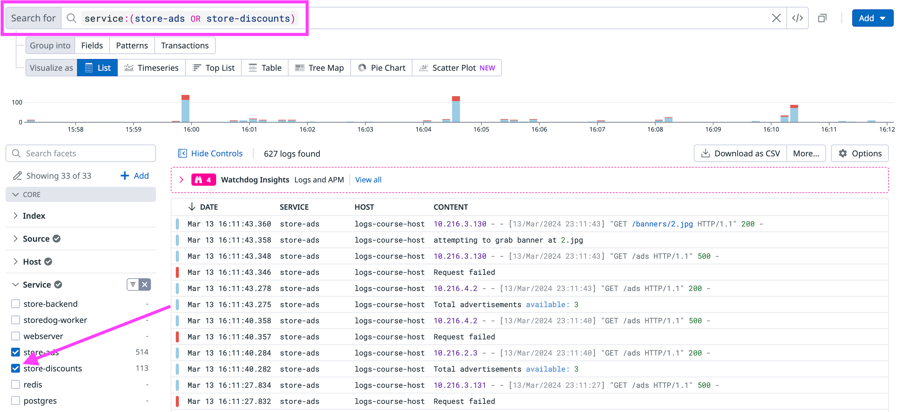
In the facets list, under Service, click the box for
store-discountsto addservice:store-discountsto the search field.Important If you have already selected one value for a key, you must click the box to select another value for the key. If you click the value name, the other value will be deselected and the new value will be selected in its place.
The list will now be filtered to display logs from both services.
In the search field, type
status:(include the colon!) and selecterrorfrom the menu in the search field.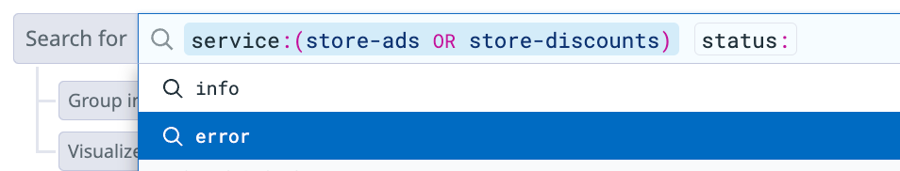
You'll see that
erroris selected forStatusin the facets list. The Timeline Graph above the Log List only has red bars, indicating that only error logs are listed for the services. Each log event has a red bar on the left that indicates that status.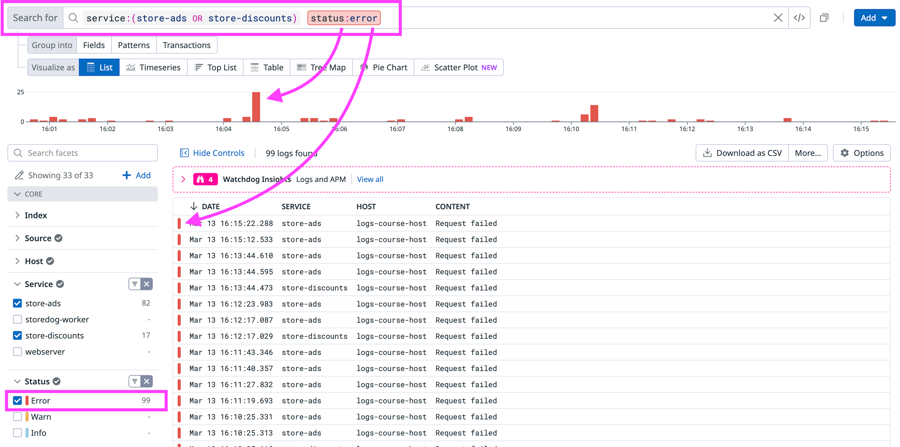
In the CONTENT column, notice that the error logs from both services mainly have the message
Request failed. These errors are likely causing the advertisements and discounts to not display in the Storedog app.Click one of the error logs to view its details.
There is an error
ValueError: Something went wrong.. This isn't a helpful message. You make a note to ask your team to make the message more descriptive.In the list of attributes, you see the
pathnameattribute. You make a note of this because one of your tasks is to create a facet for the file path.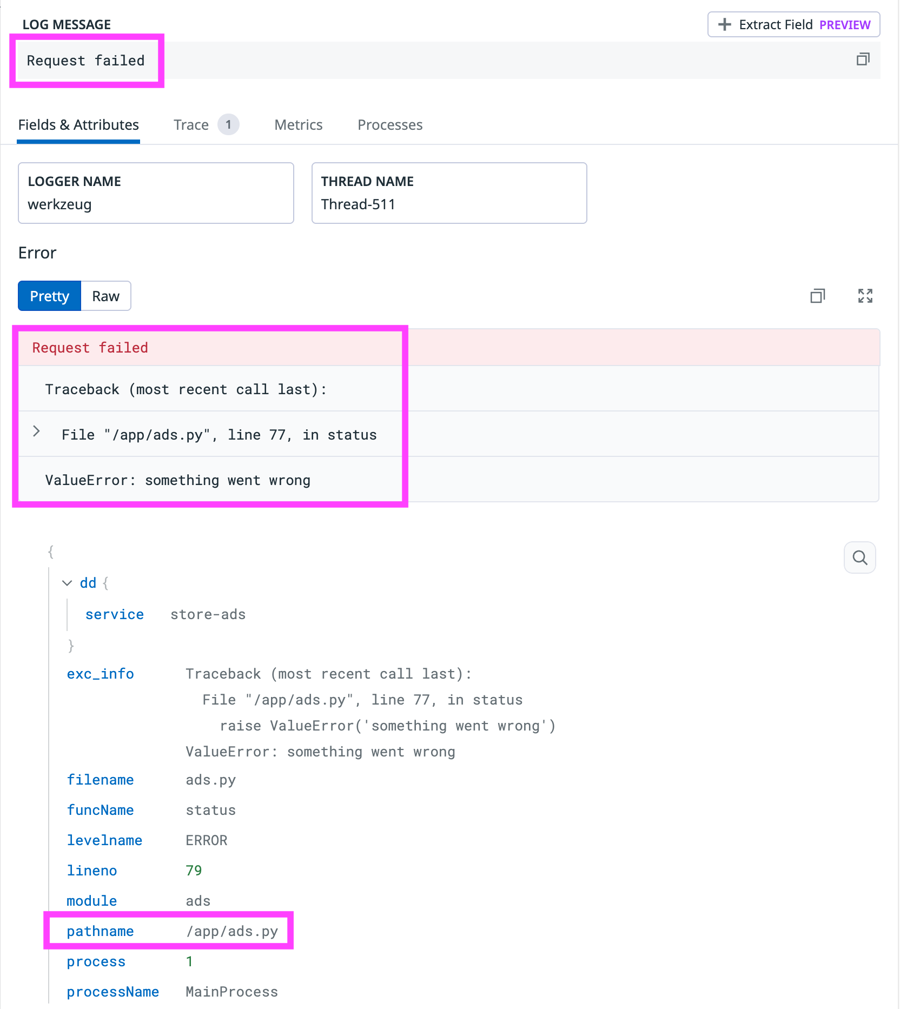
Click the Trace tab to see the associated trace.
Note If there is no associated trace, use your arrow keys to browse the list of logs until you see a log with an associated trace.
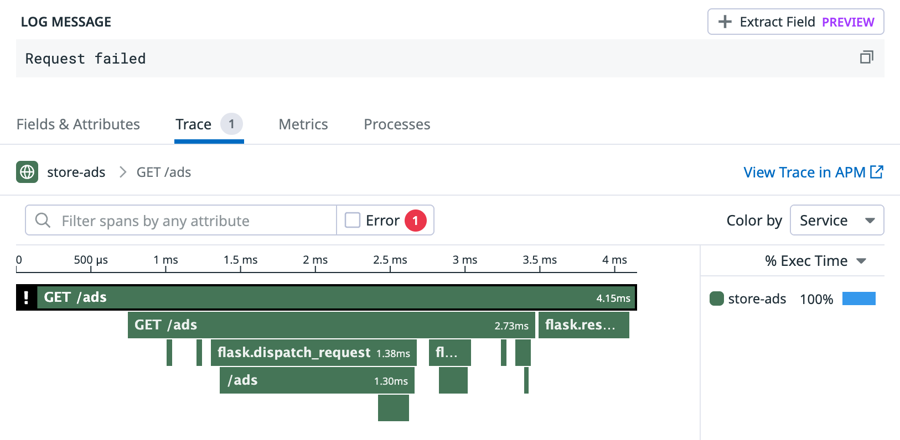
The trace also indicates an error. These errors logs are indeed the ones you are interested in.
Exit the log details by clicking the X in the upper-right corner. You will return to the Log Explorer.
You can make the search query more precise by adding the message text "Request failed" to the search field. In the search field, type the string
"Request failed"to make sure that all listed error logs are for "Request failed" errors.The final search query in the search field should look like that shown below:
service:(store-ads OR store-discounts) status:error "Request failed"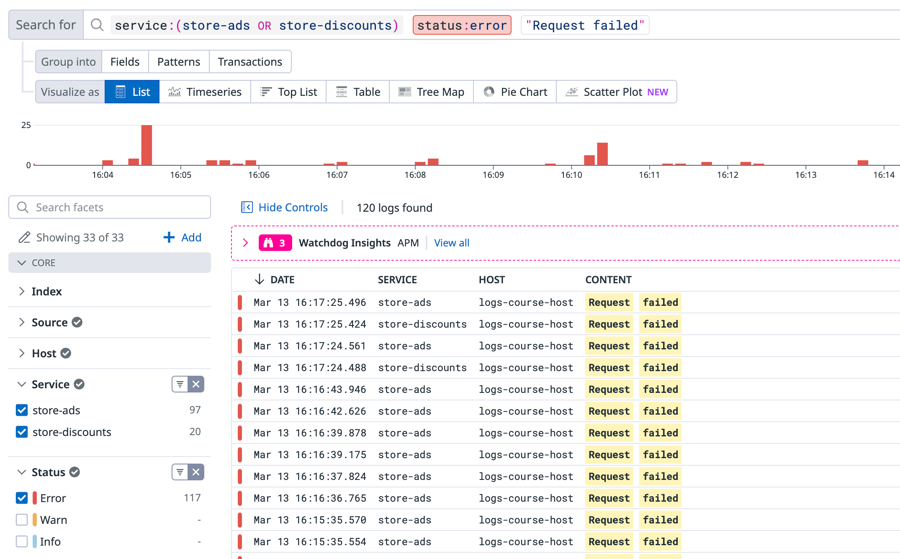


You've built the query and narrowed down the list of Storedog logs to those for the advertisement and discounts errors. Your next task is to create the Saved View for the error logs that you can share with your team.
Last updated