Datadog SIEM
Lab 1: Query and Analyze Logs
You're on the DevOps team at Storedog. Your team recently set up Datadog Log Management to ingest, structure, and enrich all logs from the Storedog app.
Customers have reported that the advertisements and discounts aren't appearing in the Storedog app. Your team lead has asked you to use Datadog Log Management to find the source of the errors.
You don't need to fix the errors, but you've been asked to do the following:
Find logs that are related to these errors in the advertisements and discounts services of the app.
Create a Saved View for the error logs that you can share with your team. The saved view should show the count and percentage of logs grouped by service.
Enable the team to search for the file path that the error originates from in the source code.
In this lab activity, you'll do the following to achieve your goals:
Build a search query using relevant facets and search terms
Create a Saved View for log analytics
Add a new facet for the file path attribute
When your team set up the Storedog app for monitoring with Datadog, they assigned the advertisements service the service:store-ads tag and assigned the discounts service the service:store-discounts tag.
You can use these tags to search for logs that are related to the errors. As you search, you'll use the search field and the facets list to build the search query.
In the time picker, set the time range to
Past 15 minutes.In the facets list, click the
Servicefacet group to expand it and then clickstore-ads. You'll seeservice:store-adsadded to the search field. The Log List only displays logs forservice:store-ads.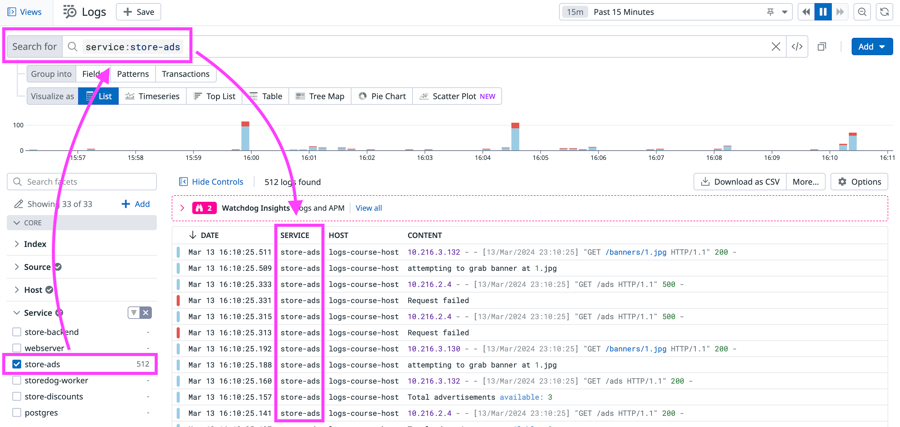
Click one of the logs in the Log List to open the details side panel.
Browse the top of the log details. You'll see the log status, date and time, and a few key tags such as
host,service, andsource. If you click these, you'll see options for querying related logs in Log Explorer and for viewing related dashboards or pages in Datadog.Below the key tags, browse the list of ALL TAGS. Click the +22 button at the end of the list to expand the list of tags. Here, you'll see that
service:store-adsis listed. You can use the search field in the tag list to find theservice:store-adstag.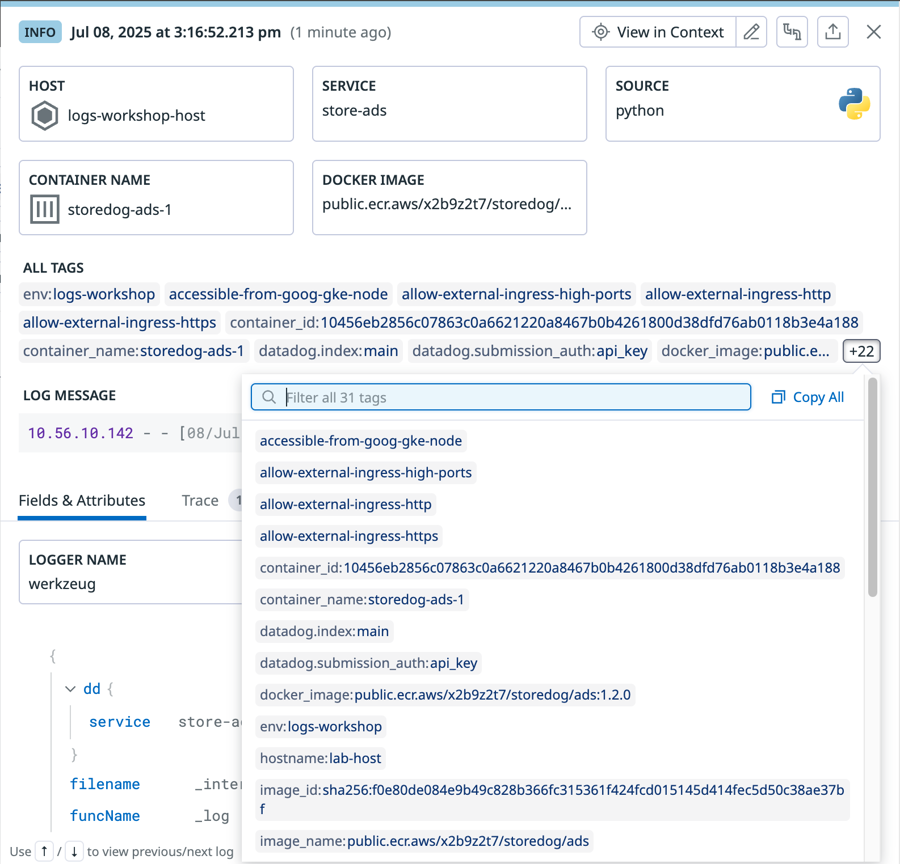
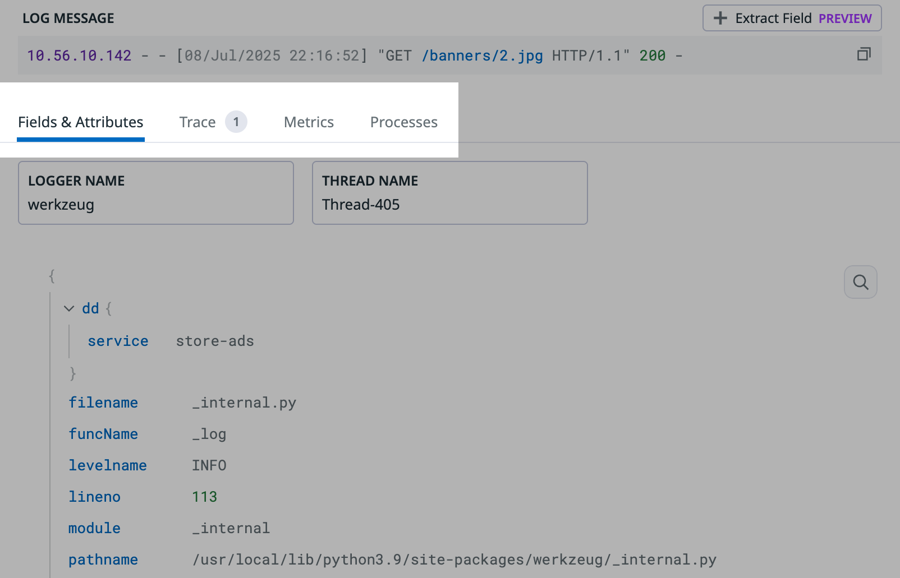
Below ALL TAGS is the official log message of the log. This log message is displayed in the CONTENT column in the Log List. In the search field above the Log List, you can search parts of this message or the whole message as a string so that you can find other logs with similar log messages.
Below the log message, click each tab and browse its contents.
Fields & Attributes lists all attributes from that log that were either in JSON format when the log was ingested, or were parsed from the log during processing after ingestion.
Trace shows the trace associated with the log, if log and trace correlation is configured. From here, you have the option to View Trace in APM.
Metrics displays host and container metrics associated with the logs. If you click any graph, you'll see options to view related data and dashboards in Datadog.
Processes are related processes running on the host and container.
Click the X in the top right corner of the panel to close it.
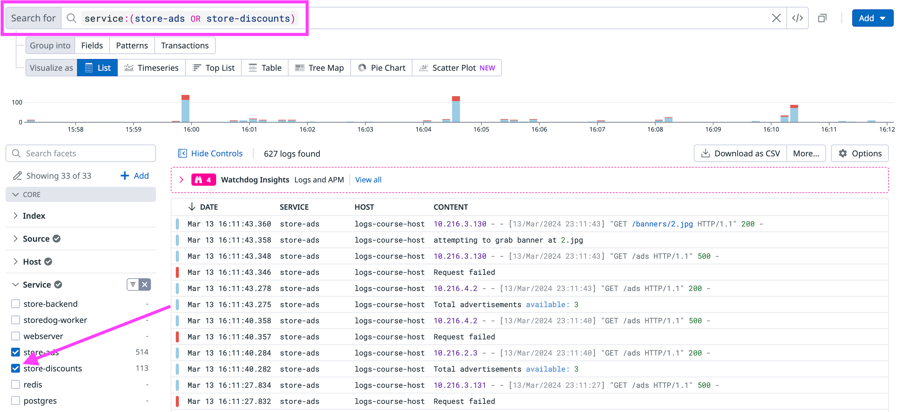
In the facets list, under Service, click the box for
store-discountsto addservice:store-discountsto the search field.Important If you have already selected one value for a key, you must click the box to select another value for the key. If you click the value name, the other value will be deselected and the new value will be selected in its place.
The list will now be filtered to display logs from both services.
In the search field, type
status:(include the colon!) and selecterrorfrom the menu in the search field.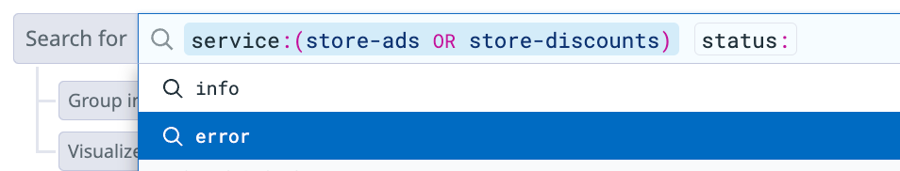
You'll see that
erroris selected forStatusin the facets list. The Timeline Graph above the Log List only has red bars, indicating that only error logs are listed for the services. Each log event has a red bar on the left that indicates that status.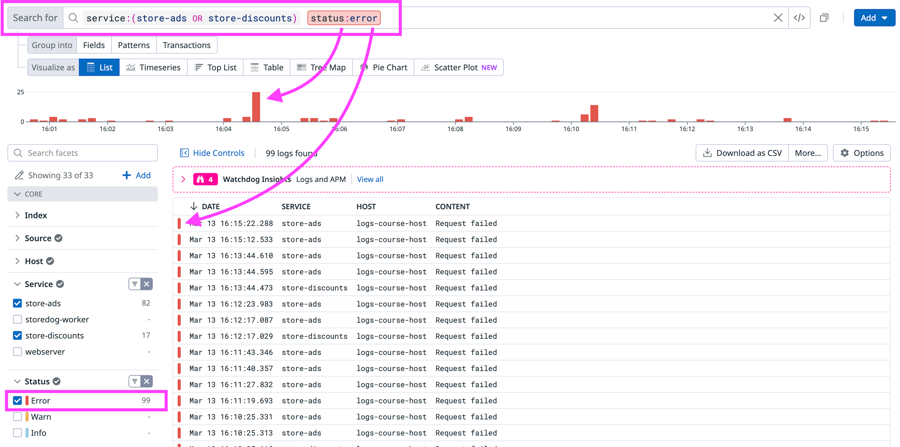
In the CONTENT column, notice that the error logs from both services mainly have the message
Request failed. These errors are likely causing the advertisements and discounts to not display in the Storedog app.Click one of the error logs to view its details.
There is an error
ValueError: Something went wrong.. This isn't a helpful message. You make a note to ask your team to make the message more descriptive.In the list of attributes, you see the
pathnameattribute. You make a note of this because one of your tasks is to create a facet for the file path.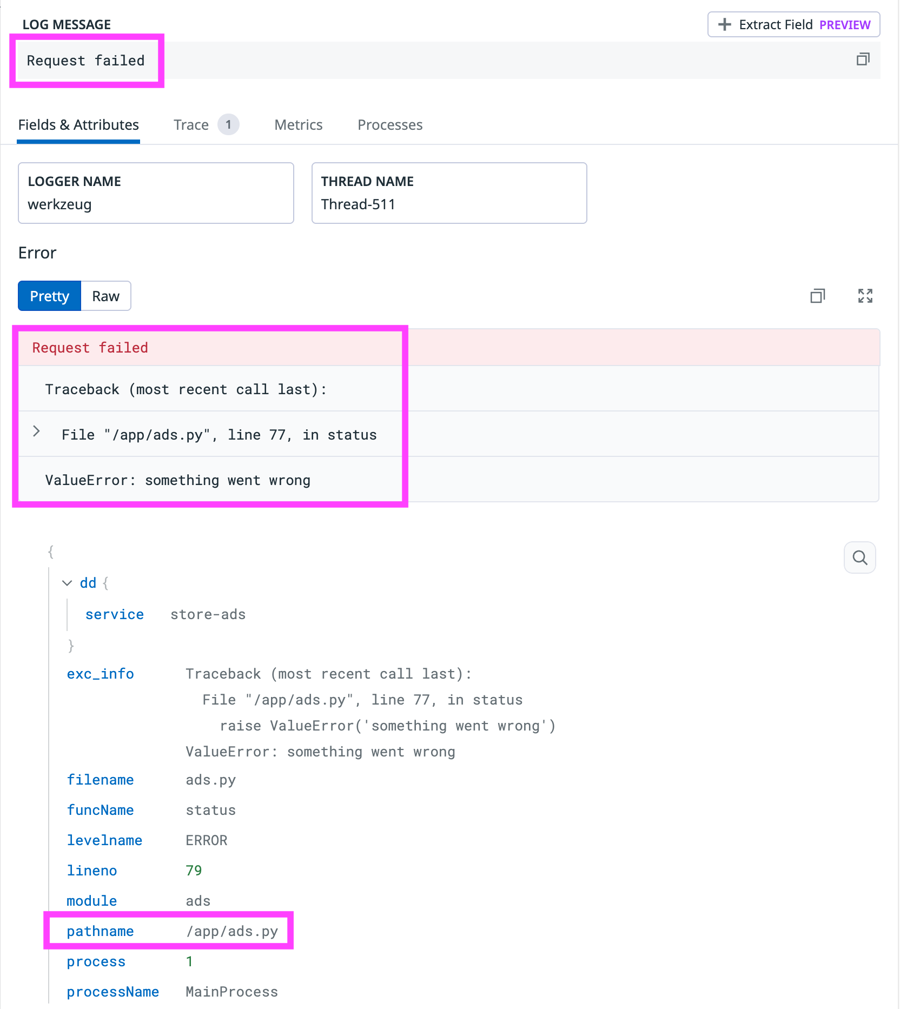
Click the Trace tab to see the associated trace.
Note If there is no associated trace, use your arrow keys to browse the list of logs until you see a log with an associated trace.
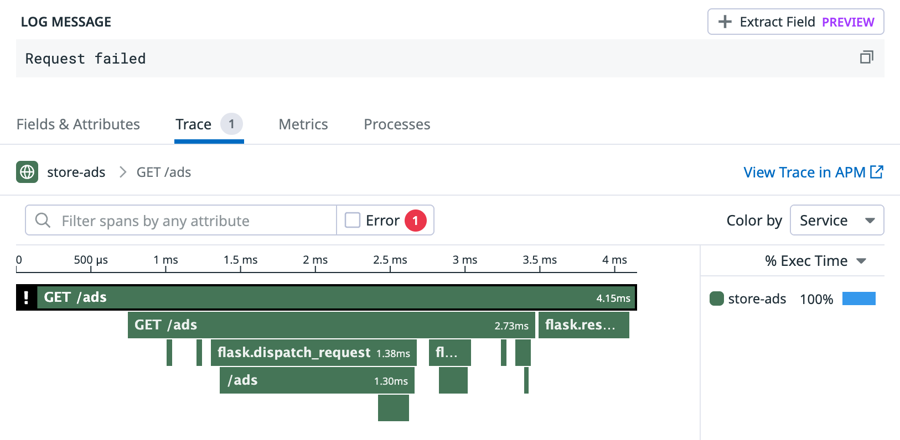
The trace also indicates an error. These errors logs are indeed the ones you are interested in.
Exit the log details by clicking the X in the upper-right corner. You will return to the Log Explorer.
You can make the search query more precise by adding the message text "Request failed" to the search field. In the search field, type the string
"Request failed"to make sure that all listed error logs are for "Request failed" errors.The final search query in the search field should look like that shown below:
service:(store-ads OR store-discounts) status:error "Request failed"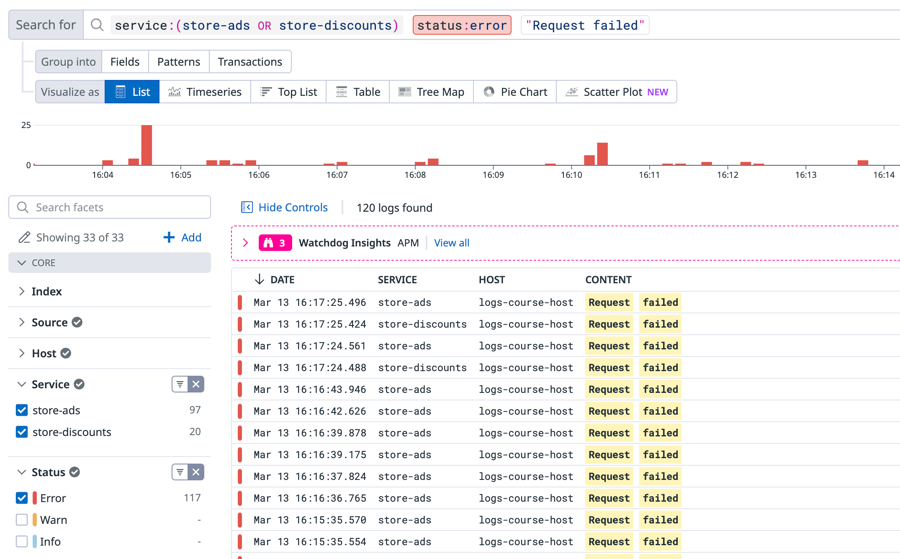


You've built the query and narrowed down the list of Storedog logs to those for the advertisement and discounts errors. Your next task is to create the Saved View for the error logs that you can share with your team.
You need to create a Saved View of service:store-ads and service:discounts logs with status:error and Request failed that shows the count and percentage of logs grouped by service. First, you'll view the different visualizations for Log Analytics and select the visualization that matches your needs. Then, you'll create the Saved View.
In the Log Explorer, below the search field, select
Fieldsfor Group into. More options will appear such as Show and by. The selection for Visualize as will also change toTimeseries.For by, click the menu and select
Service.For Visualize as, explore each type of visualization listed below. Then, answer the questions that follow.
Timeseries
Top List
Table
Tree Map
Pie Chart
🤔 Which visualization lists the counts and percentages of "Request failed" error logs for each service? Solution: All the visualizations display the count, but Tree Map and Pie Chart display the breakdown of logs by count and by percentage. You remember that your team lead likes pie charts for simpler comparisons, so you decide to the save the pie chart visualization.

🤔 Does the store-ads service or the store-discounts service have a greater count of "Request failed" error logs? Solution: The store-ads service has more "Request failed" error logs.
For Visualize as, select
Pie Chart.In the top left, above the search field, click Views to open the Views list.

You'll see out-of-the-box saved views already listed for Postgres, Redis, and Nginx. Datadog automatically added these to the list when the Storedog app came online at the start of the lab. Some services in Storedog are based on these log sources.
At the top of the list, click Save as new view.
In the New View field that appeared, copy and paste the following name:
Click Save. The new saved view will appear at the top of the list.
Above the list, click Hide to close the list.
On the right of the search field, click the
Xto clear the field.In the top left, click Views. Then, select the saved view you created earlier. On the right, you'll see that the search field populates with the search query and the associated visualization displays.

Update the time picker to
Past 1 hour. You'll see that an option to Save Changes appears next to the View name in the top left. You can click this option to update the view.In the Views list, select My View to return to the default view.
In the top left, click Hide to close the Views list.


Great! You've successfully created a saved view for the visualization that shows the count and percentage of the logs grouped by service.
You can do the optional section next to learn more about building queries with wildcards and other search terms.
Or, you can skip to the Add a facet for a log attribute section. The logs for service:store-ads and for service:store-discounts include the name of the file that the errors originate from. Your last task is to add the file name as a facet so that it's easier to search for errors associated with these files in the future.
Your final task is to enable the team to search for the file path that the error originates from in the source code. You need make the @pathname attribute into a facet so that your team can group logs by this attribute.
Datadog lists common tags and log attributes as facets by default. Many times you'll want to add facets for unique tags and attributes from your logs. Datadog provides a simple way to do this.
Use the facets list to search for
service:store-ads status:errorlogs. Then, click a log in the list to open the log details.Below Fields & Attributes, hover over the
pathnameattribute. Click the three vertical dots that appears on the left of the attribute name.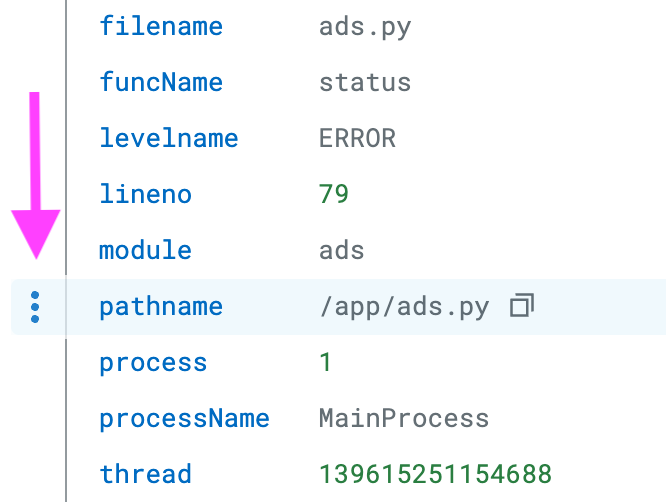
In the menu that appears, select Create facet for @pathname. The Add facet modal will open.

In the Facet tab, below the Path field, click Advanced options to expand this section.
Below Display Name, unselect the box for Use path as display name. In the field, copy and paste the following:
Path NameBelow Group, click the field and select
Source Codefrom the options.Below Description, enter the following:
File directory path
Click Add. You'll see a message that the facet was successfully created.
In the facets list, scroll to the section for Source Code and find the new facet.

In the right of the search field above the Log List, click the X to clear the field.
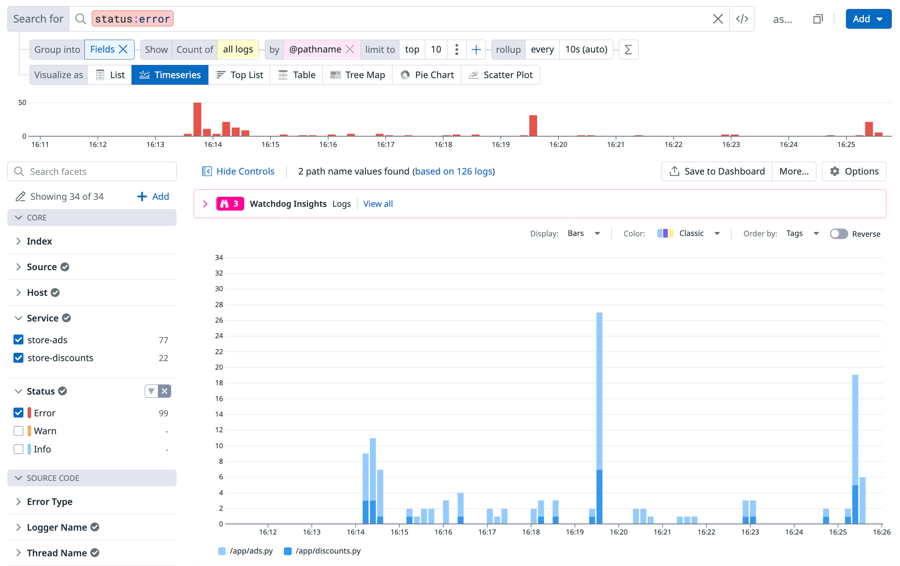
🤔 How do you create a Timeseries graph grouped by
Path Namefor logs withstatus:error? SolutionFilter the list to
status:errorlogs.Set Visualize as to
Timeseries.Set by to
Path Name (@pathname).
Clear the search query and select the List visualization.
Above the Log List, click Options to open the column display options. You decide to add a column to the list for the new facet.
Under Add a column, type
pathand select@pathnamefrom the list.
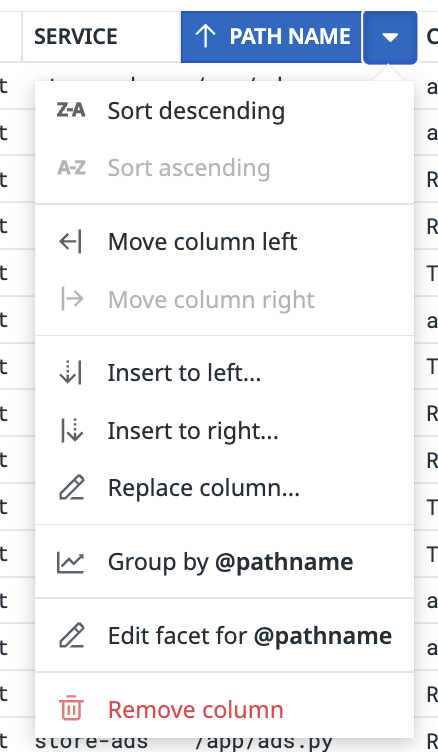
You'll see that a new column is added for PATH NAME.
Click the PATH NAME column header to sort the list by Path Name. You you can also hover over the column header to see additional options for the columns, such as sort order and inserting or replacing columns.

Check the options for the other columns. The DATE and CONTENT columns have fewer options. The HOST and SERVICE columns have options to view related data. Note You do not have to create a facet/measure for a tag or an attribute in order to add a column for it.
Create a saved view. You can give the View any name.
In the PATH NAME column option, select Remove column.
Open your new saved view. You'll see that the column name reappears.
In the top left, next to the view name, click the three dots icon, as shown below. Select Make this your default view so that the path name column is always listed in your default Log List.


Great! You've added a facet to help your team find which files the errors are originating from. This can help your team troubleshoot issues much faster in the future. You can do the optional section next or skip to the Lab summary section.
Important
To reset the view to the Datadog default view, hover over Views. Then, hover over My View. A refresh button will appear to Reset to Datadog default. Click this button and click Yes, Reset. to confirm.

Build the query using other search terms
You can use other strings and attribute values to build the search query. You can also include wildcards *, which act as a "catch all" for matching search terms.
Open your saved view and change the visualization to List.
Your query included the sequence
"Request failed". Replace this text with the search term"ValueError*"so that any log strings that starts with"ValueError"will be listed:service:(store-ads OR store-discounts) status:error "ValueError*"Notice that the CONTENT column displays the text that"ValueError*"appears in.
Replace
"ValueError*"with@pathname:/app*so that only logs with apathnameattribute value that starts with/appwill be listed.service:(store-ads OR store-discounts) status:error @pathname:/app*Notice that the options for the attribute value are displayed as you type in the field. The Log List will also display "Request failed" in the CONTENT column because you didn't included a string search term.
Replace
@pathname:/app*with*:/app*so that logs with any attribute value or strings that include/appwill be listed.service:(store-ads OR store-discounts) status:error *:/app*Notice that the CONTENT column displays the text that/appappears in.
In the Views list, select My View to return to the default view


These are some examples to show how you can use wildcards with strings and attribute values from your logs to create searches as specific or as broad as you need.
Add a measure for an attribute
While a facet has a list of unique values, a measure has a continuous set of numerical values. You can complete the following to practice creating and querying a measure.
Search for logs from
service:webserverand create a measure for the attributenetwork.bytes_written. (Click the option to create a facet, then select the Measure tab in the Add facet modal window.)Use the following for Display Name:
Bytes WrittenUse the following for Group:Web accessThe measure you create should look like this in the facets list: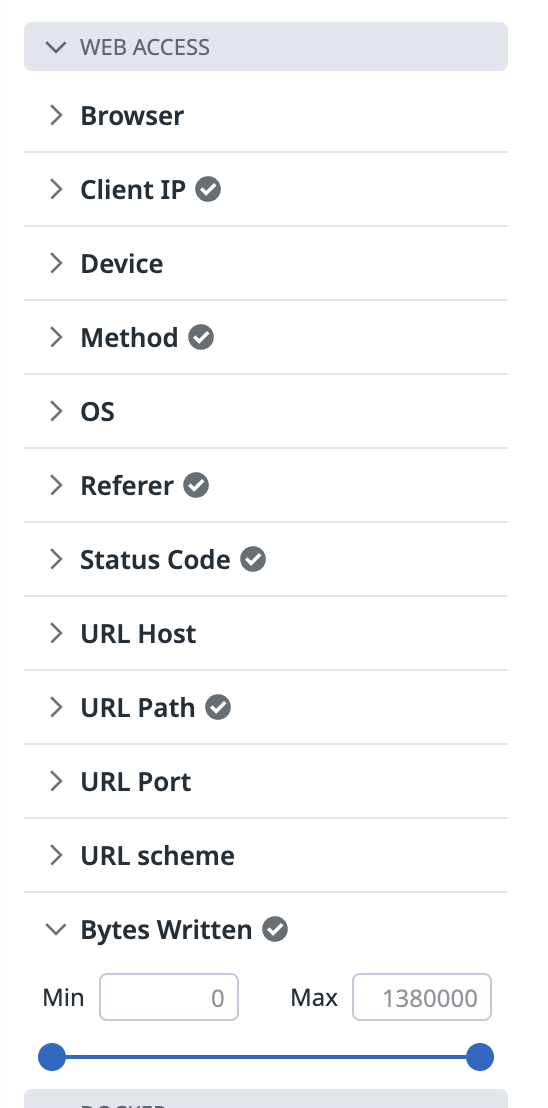
Build a query to determine the two URL paths listed in the
service:webserverlogs that have the greatest count of logs withnetwork.bytes_writtenvalues in the range of[300 TO 500]. SolutionThe search query would be
service:webserver @network.bytes_written:[300 TO 500]grouped byURL Path. You can use the Table view to list the URL paths by count. The URL paths are as follows:/api/pages
/_next/static/development/_buildManifest.js


In this lab, the following was done:
Built a search query using relevant facets and search terms
Created a Saved View for log analytics
(Optional) Built the query using other search terms
Added a facet for the file path attribute
(Optional) Added a measure for an attribute
Lab 2: Detect and Investigate Threats with Cloud SIEM
In this lab, you will use Datadog Cloud SIEM to detect real-time threats in an AWS environment.
Imagine that you are part of a team working hard to launch a new SAAS e-learning platform. Your boss has asked you to take the lead on security monitoring for the new application and the cloud environment it runs in.
You recently set up Datadog Cloud SIEM and started ingesting your AWS CloudTrail logs into Datadog for security analysis. You also configured the Cloud SIEM Content Pack for CloudTrail.
You are excited to have Cloud SIEM in place, and you want to practice using it before your app goes live. Throughout this lab, you will use an attack emulation tool to launch an attack against your environment, and then use Cloud SIEM to detect and investigate the attack.
There are two sandbox AWS accounts included in the lab:
lab-aws-account: This AWS account hosts the application you are responsible for securing. You will primarily be working in this account throughout the lab.
attacker-account: This AWS account represents an adversary AWS account. You will use it to simulate an attack.
Before launching your first attack technique, explore the out-of-the-box (OOTB) detection rules Cloud SIEM uses to flag attack techniques and suspicious activity.
Log in to the Datadog account for this lab using the Datadog credentials printed to the lab terminal. If needed, run the
credscommand to display the credentials again.In the Datadog main menu, hover over Security. Under Cloud SIEM, click Detection Rules.
You can group and sort rules using several core facets. Use the Group by selector to group the rules by
tactic.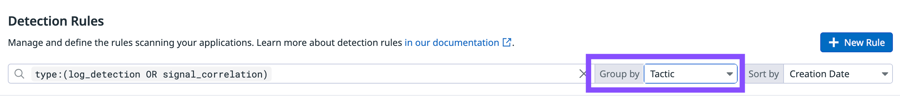
Cloud SIEM Detection Rules are mapped to MITRE ATT&CK tactics and techniques.
Expand the Initial Access section to see the OOTB detection rules that flag attacker attempts to gain an initial foothold in your environment.

Change the Group by drop-down to Source.
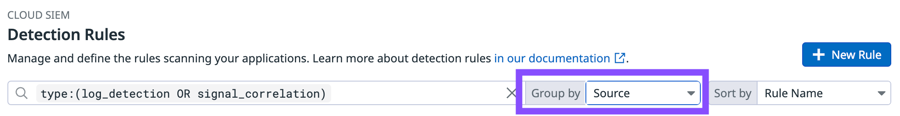
Rules are now grouped by their associated sources and Content Packs.
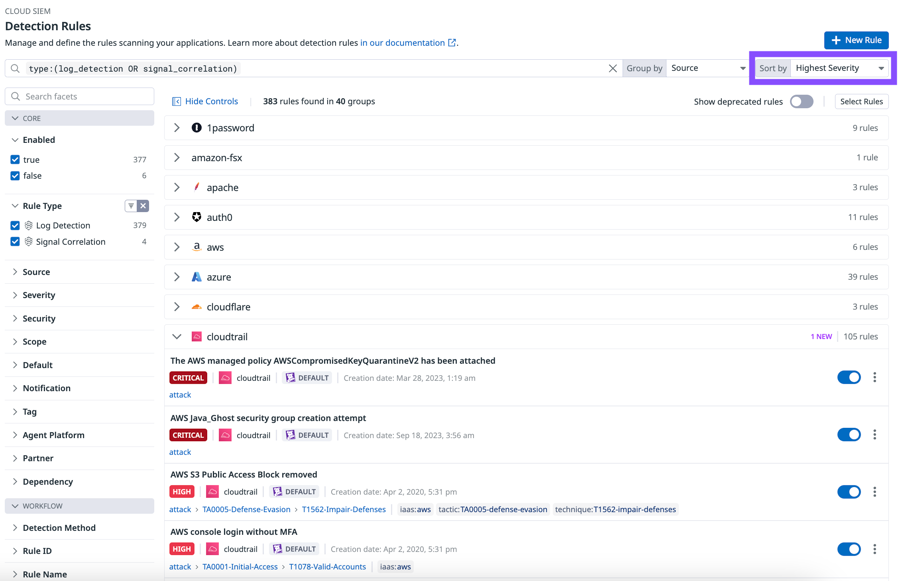
Expand the list of cloudtrail rules. These rules are from the CloudTrail Content Pack.

Change the Sort by selection to Highest Severity. Observe the highest severity rules for the cloudtrail source.
Change the Group by setting back to Tactic.

You can also use the Tactic facet to filter detection rules. In the facets list, under MITRE ATT&CK, select TA0003-persistence.
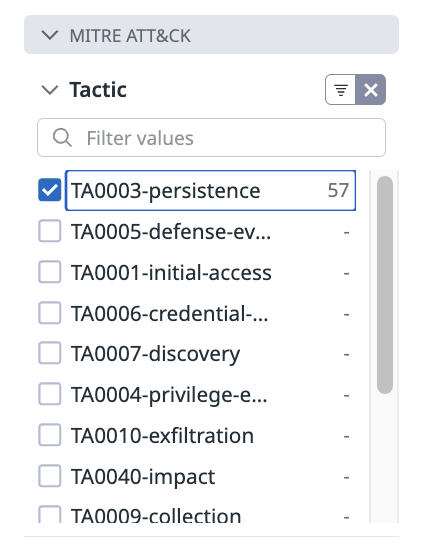
Navigate to the Source facet and select cloudtrail to further refine your query filter.
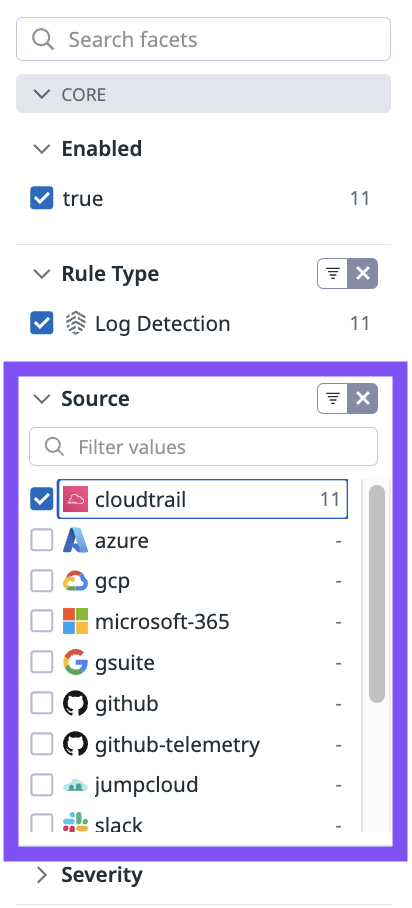
Your complete query filter should look like this:
type:(log_detection OR signal_correlation) tactic:TA0003-persistence source:cloudtrailThese detection rules flag CloudTrail activity associated with attacker attempts to maintain persistent access to your AWS enivornment.
To explore CloudTrail detection rules related to a specific AWS service, you can use the service name as a query filter term.
Add
"lambda"to your query filter.Now you see OOTB detection rules that might indicate an attacker is trying to gain persistence by exploiting the AWS Lambda service.

Click the AWS Lambda function modified by IAM user rule.
Click Edit Rule to see the rule details.

Under Define search queries, you can see the log query that powers this rule.

The
lambda_function_modifiedquery uses several facets to find matching logs.source:cloudtrailthe log must be from thecloudtraillog source@eventSource:lambda.amazonaws.comthe CloudTrail log must contain an event from the AWS Lambda service@evt.name:UpdateFunctionCode*the CloudTrail log must contain an event name matchingUpdateFunctionCode*,*is a wildcard character@userIdentity.type:IAMUserindicates the type of IAM entity who performed the action associated with the event, to match this query, the action was performed by an IAM user (as opposed to an IAM role or other type of IAM entity)-@userIdentity.invokedBy:(cloudformation.amazonaws.com OR "AWS Internal")the-is an exclusion operator, everything that follows the-must NOT be in the event for the event to match the query
Under Set Conditions, you can see how this rule generates security signals.
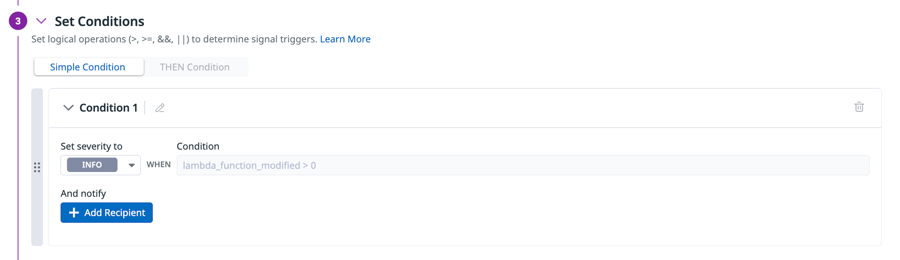
When the
lambda_function_modified > 0condition is met, this rule will generate a security signal with aninfosecurity signal.In the lab scenario, you aren't sure this rule is a good fit for your current needs. Multiple IAM users are updating Lambda functions frequently in the build-up to a big product launch. Security signals for this rule are not useful for your team.
That said, this could certainly be a useful rule in the future when you hope to manage Lambda functions only through infrastructure as code (IaC) and IAM roles.
This rule is also useful to clone and modify. For example you could modify this rule to signal when updates are made by an unexpected IAM user.
For now, you want to temporarily stop this OOTB rule from generating signals.
Find the Create a Suppression heading.
One option is to create suppression rules to limit the signals generated by defining specific conditions in which the rule should not generate a signal. For example, you could create a suppression rule that limits the signal whenever this detection rule is triggered by a known IAM user who is allowed to modify your Lambda functions.

Instead of suppressing signals based on a suppression query, you decide you do not want this rule to generate any signals at all. Use the following instructions to disable the detection rule:
Click Detection Rules to navigate back to the Detection Rules Explorer.
Use the same query to filter the rules.
type:(log_detection OR signal_correlation) tactic:TA0003-persistence source:cloudtrail "lambda"Next to the AWS Lambda function modified by IAM user rule, use the toggle to disable the rule. You can re-enable the rule at any time.


Well done! You successfully explored Cloud SIEM detection rules and disabled an unnecessary rule.
Now that you are familiar with detection rules, you are ready to put your configuration to the test!
Stratus Red Team is an open-source attack emulator that reproduces common cloud attack techniques. Stratus Red Team is already installed in your lab environment.
In the lab terminal, run the following command to see a list of attack techniques that Stratus Red Team can reproduce:
Note
You can use the following command to list AWS attack techniques specifically:
Example output (partial):
Important
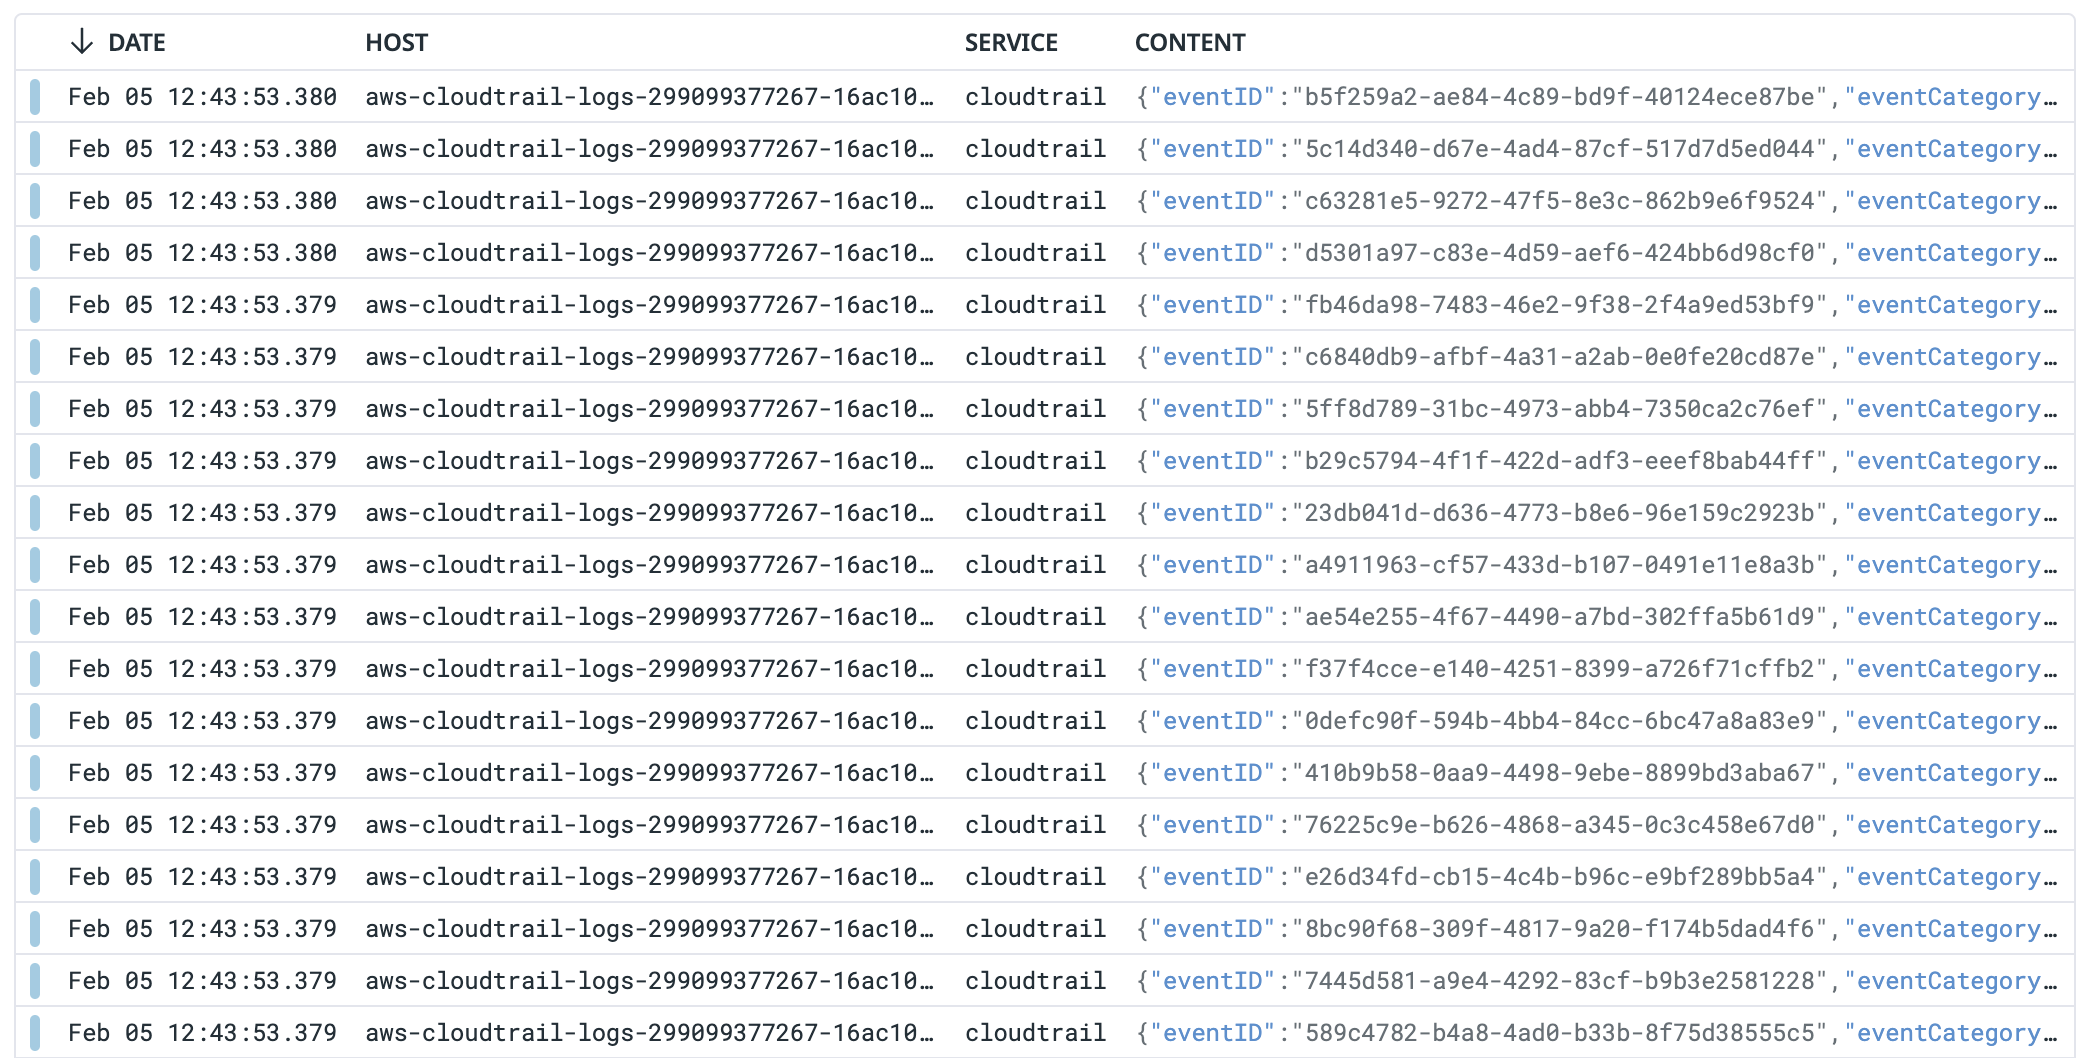
Ensure that CloudTrail logs are arriving in your trial Datadog account before running the attack commands. You can use the following link to filter logs using the service:cloudtrail query.
In this simulated attack, you will begin as the attacker user in an external AWS account. You will take advantage of a misconfigured IAM role to assume the vulnerable-role IAM role in the target account. After you have successfully assumed the vulnerable-role, you will use Stratus Red Team to simulate common cloud attack tactics.
The following diagram shows the attack path for this staged attack:

Follow these steps to stage the attack:
Note the following AWS account IDs for your current lab environment:
lab-aws-account:
381491842019attacker-account:
361769581762Run the following command to verify you are acting as the
attacker, and note the Arn for the role.Example output:
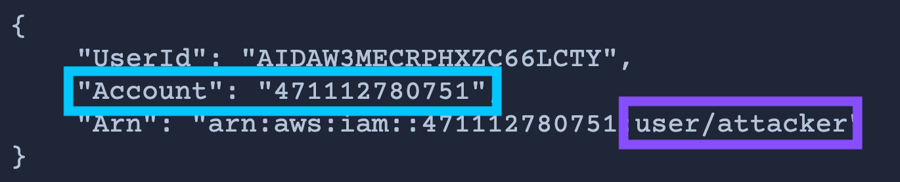
In your lab environment, the output should look like the following:
The
aws sts get-caller-identitycommand returns the IAM user or role whose credentials are being used to run commands. You are currently acting as theattackeruser in the external attacker-account AWS account.Start by emulating an
initial-accessattack tactic. Run the following command:

No output is expected.

With this command, you are simulating what would happen if an external attacker were to assume a vulnerable IAM role in your AWS lab account.
Note
If you're curious about this command, here is what is happening:
When the attacker assumes the role, a temporary session named
attacker-sessionis created.Temporary AWS session credentials are returned.
The temporary session credentials are stored in the environment variables that are used to configure the AWS CLI.
Run the
aws sts get-caller-identitycommand again and note the Arn for the role.Example output:
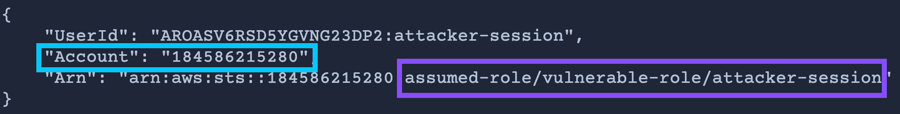
In your lab, the command output should look like the following:
The external
attackerIAM user can now use thevulnerable-roleto perform actions in the AWS lab account.Now that you have gained initial access as the attacker, emulate a
defense-evasiontactic by running the following command:


Example output:
This technique emulates an attacker deleting a CloudTrail trail in an attempt to avoid detection.
Note
More information about the
stratus detonatecommand is available in the Stratus Red Team docs.Emulate a
persistencetactic by running the following command:
Example output:
This technique emulates an attacker creating a new IAM user and attaching a permissions policy to that user. Now the attacker has persistent access to the AWS account.
Emulate a
exfiltrationtactic by running the following command: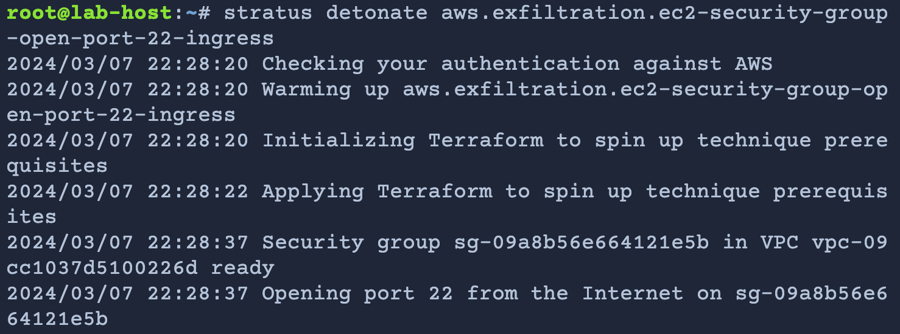
Example output:
This technique emulates an attacker opening port 22 in a security group.
Finally, run the following command to create an AWS security group named
Java_Ghost:
Example output:
The Datadog security research team has assessed with high confidence that the creation of a
Java_Ghostsecurity group is indicative of a compromised identity in AWS.


You successfully used this series of commands to emulate an attack on your AWS environment.
Specifically, you simulated four different MITRE ATT&CK framework tactics: initial-access, defense-evasion, persistence, and exfiltration. You also simulated an event in AWS that is indicative of attack behavior, based on Datadog security research.
Here is a reminder of your attack path:
In this activity, you learned how to sort and review OOTB Cloud SIEM detection rules. You also used Stratus Red Team to simulate an attack against your lab AWS account.
Now that you have staged your attack, proceed to the next lab activity where you will use Cloud SIEM to detect and investigate the attack.
Last updated